

Reference
OpenTelemetry and Prometheus
Export traces with OpenTelemetry, scrape Prometheus metrics, and read the logs of a deployed Worker.
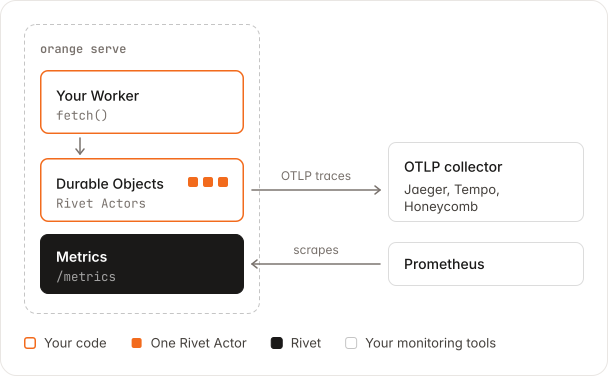
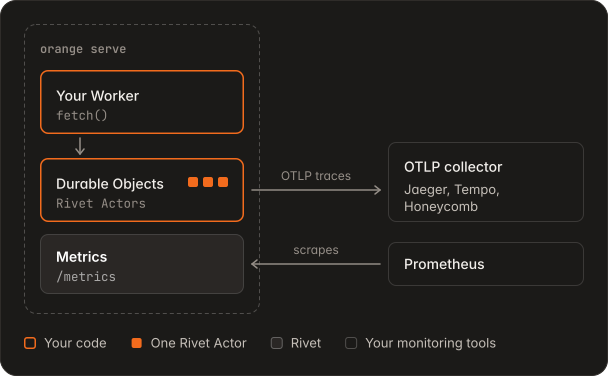
Each Durable Object runs as a Rivet Actor, so Rivet’s traces, metrics, and logs cover your objects. You turn them on with environment variables, and your code does not change.
Quickstart
You need a Rivet Cloud cluster and an OTLP collector, such as Jaeger, Tempo, or Honeycomb.
-
Send traces to your collector
orange deploy \ --var OTEL_SERVICE_NAME:my-app \ --var OTEL_EXPORTER_OTLP_TRACES_ENDPOINT:https://collector.example.com/v1/traces -
Find an object's spans
Each request and RPC call to a Durable Object is one span. Its
rivet.actor.keyis the object’s ID. -
Open metrics and logs
On Rivet Cloud these need no setup. The Rivet dashboard shows your cluster’s metrics, and its Logs page shows your Worker’s output.
Try it locally
orange dev reads the same variables from your shell.
export OTEL_SERVICE_NAME=my-app
export OTEL_EXPORTER_OTLP_TRACES_ENDPOINT=https://collector.example.com/v1/traces
orange dev
Self-host
Pass the same variables to the container. Set RIVETKIT_METRICS_PORT to serve Prometheus
metrics, and scrape them from a sidecar in the same pod.
docker run \
  -e OTEL_SERVICE_NAME=my-app \
  -e OTEL_EXPORTER_OTLP_TRACES_ENDPOINT=https://collector.example.com/v1/traces \
  -e RIVETKIT_METRICS_PORT=9464 \
  -e RIVET_ENDPOINT=... my-worker
Autoscale dynamic Workers
Scale runners on orange_worker_loader_slot_utilization and the slot queue
wait, not on CPU. See Dynamic Worker metrics for an
example.
Learn more
- OpenTelemetry: span names, sampling, and application spans
- Performance monitoring: PromQL for actors and SQLite
- Logging: log levels and formats
AI context Spans, metrics, and log output in detail
Written for LLMs and coding agents: every edge case, measurement, and known deviation. You do not need it to use the feature.
Traces
- With an OTLP endpoint set, RivetKit exports a span for each Durable Object request and RPC call, with the SQLite work inside it. The Worker’s own handlers get no spans.
- Each span carries
rivet.actor.name, which is the class in kebab case and a short hash, such asgreeter-5c8cd02c, andrivet.actor.key, which is the object’s ID. --varalso puts the variable in the Worker’senv. See Variables and secrets.- If the collector needs an API key in
OTEL_EXPORTER_OTLP_HEADERS, pass it with--secrets-file, not--var.
Metrics
RivetKit serves Prometheus metrics at http://127.0.0.1:$RIVETKIT_METRICS_PORT/metrics.
- Rivet Cloud sets
RIVETKIT_METRICS_PORTon each runner, collects the metrics, and shows them in the Rivet dashboard.orange deployrefuses to set it with--var. - Self-hosted: the endpoint listens on
127.0.0.1only, sodocker run -pdoes not expose it. Scrape it from the same network namespace, such as a sidecar in the same Kubernetes pod. orange devserves metrics whenRIVETKIT_METRICS_PORTis set, from its first Worker.- With several Workers, only the first Worker’s runtime serves metrics, so they cover that Worker’s objects only.
| Metric | What it shows |
|---|---|
rivet_rivetkit_actor_active_count | Awake actors, by actor_name |
rivet_rivetkit_actor_http_requests_active | Requests and RPC calls in progress |
rivet_rivetkit_actor_inbox_depth | Work waiting to run |
Dynamic Worker metrics
A Worker with a worker_loaders binding adds these to the same endpoint.
| Metric | Type | What it shows |
|---|---|---|
orange_worker_loader_workers | gauge | Dynamic Workers that hold a slot |
orange_worker_loader_workers_max | gauge | ORANGE_WORKER_LOADER_MAX_WORKERS |
orange_worker_loader_slot_utilization | gauge | Slots in use divided by slots, from 0 to 1 |
orange_worker_loader_queue_depth | gauge | Dynamic Workers that wait for a slot |
orange_worker_loader_queue_wait_seconds | histogram | How long each dynamic Worker waited for a slot |
orange_worker_loader_start_seconds | histogram | From a slot to a loaded dynamic Worker |
orange_worker_loader_vm_boot_seconds | histogram | How long one agentOS VM takes to boot |
orange_worker_loader_pool_claims_total | counter | VM claims by mode (network, deny) and result: hit (prewarmed), warming (waited for a prewarm), miss (booted on demand) |
orange_worker_loader_pool_ready | gauge | Prewarmed VMs by mode |
orange_worker_loader_vms | gauge | agentOS VMs by state: live, pooled, booting, stopping |
orange_worker_loader_vms_max | gauge | ORANGE_WORKER_LOADER_MAX_VMS |
orange_worker_loader_vm_queue_depth | gauge | Dynamic Workers with a slot that wait for room in the VM budget |
orange_worker_loader_rejections_total | counter | WorkerLoaderLimitError refusals by code: queue_full, queue_timeout |
orange_runtime_resident_memory_bytes | gauge | RSS by process: runner, and on Linux children, which includes the agentOS sidecar |
orange_runtime_memory_limit_bytes | gauge | The runner’s cgroup memory limit, when it has one |
Useful queries:
# Pool miss rate
sum(rate(orange_worker_loader_pool_claims_total{result="miss"}[5m]))
  / sum(rate(orange_worker_loader_pool_claims_total[5m]))
# Slot queue wait, p95
histogram_quantile(0.95, sum by (le) (rate(orange_worker_loader_queue_wait_seconds_bucket[5m])))
# Memory headroom
sum(orange_runtime_resident_memory_bytes) / orange_runtime_memory_limit_bytes
The agentOS sidecar’s own request queue is not visible to Orange, so it has no metric.
Autoscaling
With a Kubernetes HorizontalPodAutoscaler and a Prometheus adapter:
- Scale on
orange_worker_loader_slot_utilization, with a target of about 0.7, and on the p95 oforange_worker_loader_queue_wait_seconds. A busy slot can mean a dynamic Worker that waits on I/O, so CPU does not show dynamic Worker demand. Do not scale on CPU. - Set
behavior.scaleDown.stabilizationWindowSecondslonger thanORANGE_WORKER_LOADER_IDLE_TIMEOUT_MS(30 s by default), such as 300 s. An idle dynamic Worker holds its slot until the timeout, so a shorter window scales down while slots still look busy, and then scales up again. - Alert on
orange_worker_loader_rejections_total. Each refusal is a 503 or aWorkerLoaderLimitErroryour Worker caught. - Size the pod’s memory limit for
ORANGE_WORKER_LOADER_MAX_VMSVMs, and watchorange_runtime_resident_memory_bytesagainstorange_runtime_memory_limit_bytes. - Orange has no readiness endpoint, so a full runner still receives
requests. Its 503s carry
Retry-After.
Logs
orange devprints each request and your Worker’sconsoleoutput.orange serveprints theconsoleoutput and RivetKit’s warnings and errors.- Self-hosted, read the container’s output.
- Set
RIVET_LOG_LEVEL=infoto add RivetKit’s info logs.